
Increased corn acreage results in falling prices
Corn prices continue to fall
Last month we used this space to discuss threats to corn yields (specifically, effects from wildfires and drought) which, depending on how they manifest, could ultimately boost corn prices. It’s still too early to determine the effects of these threats, but in the meantime the downward trend in spot corn prices steepened through mid-July. As of the second week of July, the price of corn had dropped to $5.26 per bushel, down more than a dollar per bushel from three weeks prior to the lowest price since October 2021.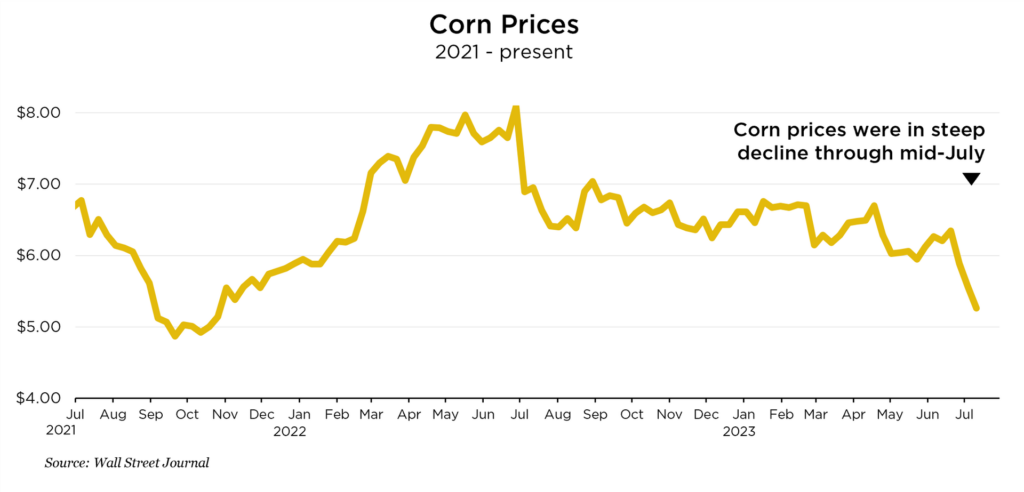
The USDA’s June 30 Acreage report calls for higher-than-expected corn production, which is likely a significant contributor to declining prices.
The report specified an increase in forecast production to 55 million bushels due to greater planted and harvest acres than previously estimated. July’s World Agriculture Supply and Demand Estimates (WASDE) shows only a minor offset to this increased acreage coming from a 4.0-bushel yield reduction down to 177.5 bushels per acre.
Furthermore, while much of the Corn Belt has experienced various degrees of drought this growing season, it’s expected that recent rains and cooler weather in some of the most affected parts of the region will blunt those impacts on corn yields and production.
Prices are expected to continue to fall from here. The USDA forecast for season average price received by producers had dropped to $4.80 per bushel.
Demand estimates are still solid as total corn usage is estimated to be well above what it was in 2022/23 season, when the average price was $6.60 per bushel. This suggests that higher supply, due to farmers planting more corn acres to take advantage of the high price environment, is dominating price movements even with demand up from last year.
Ag News Highlights
Wheat harvest slow in some states
Kansas, the state with the largest wheat acreage in the country, has had a dichotomous harvest season. The east side of the state is experiencing a lot of dryness which is conducive to harvesting and has led to a much earlier wheat harvest than normal for many farmers. However, the west side of the state is where most of the wheat production comes from, and much of that area has experienced a devastating combination of drought conditions in the growing season and rainy conditions in the harvest season. This has produced weeds that are taller than some of the low-yield wheat. Coupled with wet fields this means farmers will have to decide how much of their fields will be harvested and how much will be abandoned. In May, the Kansas Wheat Tour projected an abandonment level of 19 percent, but that high number could rise further due to recent rains.
In terms of harvesting progress, Kansas appears to be the dividing line between the eastern wheat-producing states, which are mostly ahead of schedule, and the western wheat-producing states, which are generally behind schedule. Kansas in total was 25 percent behind the five-year average for the week ending July 9, and Colorado and California were 31 and 29 percent behind, respectively. Other wheat-producing states were closer to or in line with their normal pace, with Ohio being the only significant outlier. (AgWeb)
Crop condition worsen in 2023
At this point in the growing season, row crop condition is worse than last year, but there has been some improvement recently. As of July 9, 55 percent of the U.S. corn crop was in good or excellent condition, which is an improvement of four percentage points from the week prior. However, it’s significantly lower than this time last year, when 64 percent of the crop reached that threshold. Similarly, 15 percent of the crop is rated poor/very poor, which is a slight improvement from the week before but lags 2022.
The one-week change to the soybean crop condition was smaller, with only a slight improvement in the portion rated good/excellent and no change in the poor/very poor percentage. Compared to a year ago, the share of the soybean crop in good/excellent and poor/very poor condition is 11 percentage points lower and six percentage points higher, respectively. (USDA)
Citations/Disclaimers
-
The information in this report is provided by Nationwide Economics and is general in nature and not intended as investment or economic advice, or a recommendation to buy or sell any security or adopt any investment strategy. Additionally, it does not take into account any specific investment objectives, tax and financial condition or particular needs of any specific person.
The economic and market forecasts reflect our opinion as of the date of this report and are subject to change without notice. These forecasts show a broad range of possible outcomes. Because they are subject to high levels of uncertainty, they will not reflect actual performance. We obtained certain information from sources deemed reliable, but we do not guarantee its accuracy, completeness or fairness.